


Curious about what’s really happening in the dating app world?
You’re in the right place.
The dating game in 2025 looks nothing like it did just a few years ago. Dating apps have evolved from casual swiping tools into serious business platforms- ones that move billions, shape social behavior, and create real-world connections.
This isn’t just about love anymore. It’s about market share, user behavior, and massive potential.
Right now, dating app statistics show skyrocketing user growth, shifts in demographics, and some eye-opening trends across race, gender, and engagement.
The global dating app statistics for 2025 point toward one thing: the industry is only getting stronger.
You’ll see stats on how many people are using these platforms, how much time they’re spending on them, and how the overall dating app statistics for 2025 reflect a cultural shift in how we meet, date, and build relationships.
This is your deep dive into the numbers that matter. If you're building an app, pitching investors, analyzing user behavior, or just watching the space, these insights will help you understand the full picture.
Let’s get into it.
Dating Market Statistics: Revenue, Growth & Global Reach
The online dating industry is experiencing remarkable growth in 2025, driven by evolving user behaviors, technological advancements, and an increasing number of global users.
Understanding the latest dating market statistics is essential to grasp where the industry is headed. If you plan to start an online dating business, this might be life-changing information.
After all, these statistics reveal significant revenue trends, user growth, and regional variations that are reshaping the dating landscape.
-
-
Global Market Size: The global online dating market was valued at USD 9.65 billion in 2022 and is expected to reach USD 17.28 billion by 2030, growing at a CAGR of 7.4%.
-
This growth reflects the strong momentum of the dating market statistics, showing a robust rise in both revenue and user engagement across various platforms.
.webp)
-
-
Earnings in 2025: Revenue in the online dating market is forecasted to reach US$3.17 billion in 2025. This is expected to grow at a CAGR of 2.14% from 2025 to 2029, leading to a projected market volume of US$3.45 billion by 2029.
-
These illustrate how dating app usage statistics continue to reflect a growing willingness to pay for premium services, highlighting a major shift toward monetization models.
-
- Expanding User Base: According to dating app statistics, the number of users is expected to rise to 452.5 million by 2028, with increased penetration from 5.1% in 2024 to 5.7% by 2028.
- Regional Growth: While North America continues to lead in revenue, the Asia-Pacific region is showing the highest growth rates in both app downloads and active users.
The adoption of dating apps in emerging markets, fueled by higher smartphone penetration and digital adoption, significantly influences these dating app statistics.
-
-
Subscription Models: A significant portion of the dating app revenue comes from subscription-based services, which account for over 63% of the total market share.
-
This continues to be one of the strongest drivers in dating market statistics, proving that users are increasingly willing to pay for a better dating experience with premium features.
-
-
Average Revenue Per User (ARPU): By 2024, the average revenue per user (ARPU) is expected to reach USD 7.90, reflecting how the dating app usage statistics are evolving with a more monetized user experience across popular platforms like Tinder, Bumble, and Hinge.
-
Dating App Statistics: 2025 Edition
The online dating landscape continues to shift in 2025, with impressive growth, evolving user behavior, and changing demographics.
This section breaks down the most current dating app statistics, highlights global trends, and provides real insight into the projections for dating app statistics in 2024 & 2025.
1. User Base Growth
By 2028, the number of global number of online dating users is projected to grow to 452.5 million.
In 2024, the market penetration rate stood at 5.1%, with expectations to rise to 5.7% by 2028.
This growth highlights the expanding reach of the online dating industry as more people from diverse demographics increasingly turn to dating apps to find meaningful connections.
2. Rise in Baby Boomers
An interesting dating app statistic for 2024 & 2025 is the significant rise of Baby Boomers (ages 59-72) as the fastest-growing user group on dating platforms.
This shift reflects a cultural change, showing that older generations are becoming more comfortable using technology to seek companionship, highlighting the expanding age demographic in the online dating market app statistics.
3. Male Leading the Dating Apps
Recent dating app statistics reveal a narrowing gender gap on leading platforms. By 2024, 61% of Bumble users were male, while 39% were female.
Similarly, Tinder saw a male-dominated user base, with 75.8% identifying as male and 24.2% as female.
These figures suggest a significant shift in the gender dynamics of dating apps, with platforms adjusting their features to cater to a more diverse audience.
4. 50% of Dating App Users Prefer Connecting Over Shared Interests
Approximately 50% of users prioritize connecting with others who share similar hobbies and interests.
This suggests that shared passions and values may hold more weight than just physical attraction when forming meaningful connections.
Interestingly, online dating market app stats show that this behavior is particularly strong among users between the ages of 25 and 34.
5. 60% of Users Research Matches on Social Media Before Meeting
According to recent statistics of online dating apps, 60% of users now look up their potential matches on social media before meeting in person.
This trend indicates a growing concern for safety and authenticity, as users aim to ensure that their online matches are genuine.
Social media checks have become a standard step in the process, contributing to the online dating market app statistics on how technology is shaping modern dating behaviors.
6. Catfishing on Dating Apps: A Growing Concern
As per recent dating app stats, around 38% of men and 30% of women have experienced catfishing on dating platforms.
Catfishing, where individuals use fake identities to deceive others, is a prevalent issue that has raised concerns about safety and trust in the online dating world.
Despite these risks, online dating app statistics indicate that many users continue to navigate these challenges, with platforms implementing new security measures to combat fake profiles and improve user protection.
Top Dating Apps Leading the Market: Download Stats & Insights
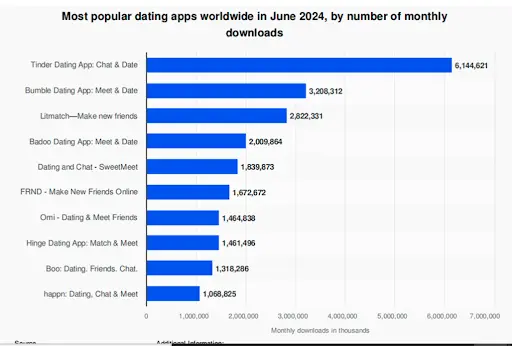
Here are some of the top dating apps that are making it huge in the market:
|
Dating App |
Revenue (2025) |
Users (2025) |
Projected Revenue (2030) |
Projected Users (2030) |
|
Tinder |
$2.1 Billion |
100 Million |
$3.6 Billion |
140 Million |
|
Bumble |
$900 Million |
45 Million |
$1.7 Billion |
80 Million |
|
Hinge |
$450 Million |
20 Million |
$1.1 Billion |
50 Million |
|
OkCupid |
$300 Million |
30 Million |
$600 Million |
55 Million |
|
Grindr |
$250 Million |
15 Million |
$520 Million |
35 Million |
|
Coffee Meets Bagel |
$120 Million |
10 Million |
$250 Million |
25 Million |
|
Happn |
$100 Million |
8 Million |
$220 Million |
18 Million |
|
BLK |
$90 Million |
5 Million |
$200 Million |
15 Million |
|
Her |
$80 Million |
4 Million |
$170 Million |
12 Million |
|
eHarmony |
$400 Million |
12 Million |
$750 Million |
30 Million |
Let’s check out some detailed performance comparisons of these dating apps:
1. Tinder
-
- Launched in 2012
- In 2024, Tinder boasted 60 million monthly active users and 9.6 million paying subscribers.
- Additionally, 60% of its user base is under the age of 35.
Tinder’s innovative "swipe" feature continues to dominate dating trends, with millions of matches created daily, a key factor behind its success in global dating app download statistics. It’s an excellent model for those who want to create an app like Tinder that capitalizes on simplicity and user engagement.
2. Bumble
-
- Launched in 2014
- In 2024, 28% of American adult online dating users have tried Bumble, ranking it as the third most popular dating platform.
- The app’s quarterly revenue hit $215.8 million in Q1 2024.
Bumble’s female-first approach has led to increased user trust, especially in dating app statistics by gender. If you're looking to make an app like Bumble that empowers women while creating genuine connections, Bumble’s model of safety and empowerment is a great blueprint.
3. Hinge
-
- Launched in 2012
- Hinge generated $550 million in revenue, reflecting a 38% year-over-year growth.
- In the U.S., the app holds an 18% share of the dating market.
Focused on serious relationships, Hinge’s matching algorithm pairs users based on shared interests and compatibility, as reflected in its impressive dating app match statistics.
To create an app like Hinge, focus on fostering deeper connections and relationship-building tools.
4. OkCupid
-
- Launched in 2004
- OkCupid experiences more than 10 million swipes every day.
- In Q1 2024, the platform earned $30 million in revenue.
OkCupid's detailed questionnaires and inclusivity make it a go-to for those interested in finding meaningful connections, as supported by its diverse dating app ethnicity statistics.
Making an app like OkCupid involves prioritizing detailed profiles and algorithms that focus on compatibility.
5. Grindr
-
- Launched in 2009
- In 2023, Grindr had over 13.5 million active users, making it the fourth highest-grossing dating app globally for LGBTQ individuals.
- It now boasts around 13 million monthly active users and 145 million total registered users.
Grindr’s location-based matching system caters specifically to LGBTQ+ men, with geolocation driving much of its success in dating app race statistics. For many, apps like Grindr are a great inspiration to create an LGBTQ+ app.
6. Coffee Meets Bagel
-
- Launched in 2012
- Monthly Active Users (2024): Approximately 8 million
- Revenue (2024): Estimated at $110 million.
This app stands out by offering a limited number of matches per day, encouraging users to focus on quality rather than quantity. Its dating app success statistics highlight the effectiveness of this approach in reducing swiping fatigue and fostering real connections.
7. Happn
-
- Launched in 2014
- 10 million active users in 2024.
- 10 million daily swipes, emphasizing proximity-based connections.
By connecting users who have crossed paths in real life, Happn offers a unique approach to meeting potential matches based on proximity, which ties into dating app race statistics as it fosters real-world connections.
To make an app that mirrors this, location-based technology should be a key focus.
8. BLK
-
- Launched in 2017
- 4 million active users as of 2024.
- 25% increase in user engagement in 2023, focusing on Black singles.
BLK caters specifically to Black singles, with dating app ethnicity statistics showing increasing demand for platforms that serve specific communities.
If you’re aiming to create a niche-based app targeting a specific demographic, focusing on cultural relevancy and community support like BLK will be key.
9. HER
-
- Launched in 2013
- 4 million active users, primarily from LGBTQ+ communities.
- 75% of users engage weekly, fostering a sense of community.
HER is a safe space for LGBTQ+ women and non-binary individuals, promoting both dating and social networking in a welcoming environment.
HER’s focus is on inclusivity and diversity; take notes from it to develop a transgender app to have a diverse user base.
10. eHarmony
-
- Launched in 2000
- 12 million active users using personality-based matching.
- 2 million marriages facilitated by its compatibility algorithm.
eHarmony’s personality-based matching system continues to drive its success in creating long-term relationships, supported by high dating app success statistics.
For anyone wanting to create an app like eHarmony focusing on long-term compatibility, the in-depth profiling system of eHarmony offers essential lessons.
With this being out of the way, let’s get to know about the market statistics of dating apps Gender Wise.

Dating App Statistics by Gender: Men vs Women
So… who’s really winning the swipe game– men or women?
Let’s break it down. The latest dating app statistics by gender show there’s a serious imbalance in how men and women experience dating apps.
Here’s what you need to know:
-
- Men swipe right way more--up to 60-70% of the time--while women swipe right only 5-15%.
- Dating app statistics for men show they send 3x more messages than women, but their response rate is only about 10-15%.
- On the flip side, women receive significantly more messages, sometimes up to 10x more than men, but only reply to a small percentage.
- Dating app statistics for men vs women also reveal that women tend to delete apps sooner, often citing overwhelm or lack of meaningful conversations.
- Men, especially younger users, are more likely to use dating apps longer and more frequently, hoping to eventually land a match.
- The match rate for women is much higher--some studies show women match with nearly 50% of the profiles they swipe right on, while men match with only about 3-5%.
Dating App Statistics by Race & Ethnicity
If you feel like race plays an important role in your dating app experience- you are absolutely right. The number tells a different story.
Here are the most up-to-date dating app race statistics for 2025:
-
- As per dating app statistics by race, Asian men receive 19% fewer matches compared to white men on big platforms like Tinder and Bumble.
- Asian men’s dating app statistics also show they’re the least likely to get a reply to a first message- averaging a response rate below 10%
- As per black women’s dating app statistics, they receive the lowest number of matches and likes overall. On OkCupid, they have a response rate of just 9%, the lowest across all demographics.
- In contrast, white women get the highest response rates, often up to 3 times more than Black or Asian women.
- Latino men and women see average match rates but are more likely to connect with users of the same ethnicity.
- White men and women are statistically the most desired across nearly all dating platforms, based on dating app race statistics.
- Cross-racial interest has grown slightly since 2020, but over 60% of users still prefer to match within their own racial group.
- Apps focused on ethnicity and culture--like BLK, Chispa, and EastMeetEast--report match success rates up to 40% higher for minority users compared to mainstream apps.
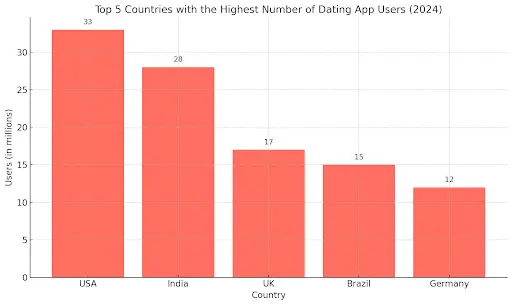
Top 5 Countries with the Highest Number of Dating App Users
Curious about where people are swiping the most? Here's a look at the countries leading the global dating app scene based on mobile dating app statistics and user engagement trends.
These countries aren’t just using dating apps--they're driving the innovation, user trends, and even shaping the future of digital dating.
-
- United States: The U.S. leads with over 33 million active users, making it the largest market for mobile dating apps. According to recent statistics about dating apps, nearly 1 in 3 Americans have tried at least one dating app.
- India: India is booming in the dating space, with over 28 million users. With a young, tech-savvy population, the country is seeing rapid growth in app dating statistics, especially among Gen Z and millennials.
- United Kingdom: With around 17 million users, the UK ranks third. Dating app relationship statistics show that over 35% of UK couples now meet online--more than through friends or work!
- Brazil: Brazil’s vibrant dating culture and social lifestyle drive 15 million users to dating platforms. It’s one of the fastest-growing markets, reflecting strong momentum in global dating app statistics.
- Germany: Germany rounds out the top five with 12 million users. Mobile dating app statistics show German users prefer serious dating apps, with a trend toward long-term relationships.
Many of these countries are not just high in user volume but also in engagement. Users in these regions tend to spend 20–30 minutes daily on dating platforms.
Across all five nations, the shift toward mobile-first experiences has transformed how relationships begin--fueled by data, personalization, and user-driven matchmaking.
Swipe, Match & Message Behavior on Dating Apps
Let’s be real dating apps are no longer just digital matchmakers. They’re data-rich ecosystems.
If you're planning to build a dating app or optimize an existing platform, diving into the statistics of dating apps gives you a competitive edge.
From swipe trends to match probability and how often people actually message each other everything ties back to user engagement and app retention.
Let’s break it all down.
► Swipe Behavior: The Fastest Decision-Making in Dating
Swiping is addictive for a reason.
It’s designed to be effortless, visual, and fast-paced but behind every swipe is a decision that influences your app’s engagement rate.
Here’s what the dating app swipe statistics tell us:
-
- The average user swipes right on just 14% of profiles.
- That’s 1 right swipe for every 6–7 left swipes.
- Top-tier users (in terms of profile quality) can receive 10x more right swipes than average users.
- Users spend up to 90 minutes per day swiping, often in short bursts of 3–5 minutes.
- Most swipes happen during evening hours, peaking between 8 PM & 9 PM on monday.
Pro insight: Boost swipe engagement by showing high-interest profiles during these peak hours using predictive engagement scoring.
► Match Probability: Small Percentage, Big Potential
Matches are the “aha” moment of dating apps -- but they don’t come easy.
The dating app match statistics reveal:
-
- Match rates average between 3% to 9%, depending on the user’s location, age, and profile content.
- Men swipe more, but women have higher match conversion rates -- creating a behavior gap most apps try to balance.
- Users with at least 4 profile photos and a short bio see up to 60% more matches.
- Including verified badges or "Recently Active" indicators increases match chances by 15-20%.
Want your app to stand out? Help users build better profiles -- with smart prompts, real-time profile feedback, and feature unlocks that reward high engagement.
Pro feature idea: Show users how their profile ranks in matchability to gamify improvements and boost retention.
► Messaging Behavior: Where Real Engagement Begins
Getting the match is just half the game.
The real test? Whether that match turns into a conversation.
Check out these statistics of dating apps around messaging:
-
- Only 30-35% of matches result in someone sending a message.
- Of those, only 15-20% evolve into a two-way chat.
- Message response time is critical -- if no one replies within 30 minutes, the chance of a continued conversation drops by 60%.
- First messages that include a question are 20% more likely to get a response.
- Users who receive a message within 10 minutes of matching are 3x more likely to continue chatting.
Design-wise, this is where subtle nudges and intelligent UI can turn passive users into engaged ones.
Engagement boosters to consider:
-
- AI-generated icebreakers
- “This or That” games to start convos.
- Quick reply suggestions based on chat tone
- Conversation streak rewards (like Snapchat-style streaks)
Bottom line: Messaging is the glue of your dating app. The better you design for it, the longer your users stay.
Dating App Statistics 2024 vs 2025: What’s Changed?
A lot can shift in just 12 months -- and the dating app space proves it.
From swipe behavior to match rates and emerging platforms, comparing dating app statistics 2024 to dating app statistics 2025 reveals some seriously interesting trends.
Whether you're a startup founder or an investor eyeing this space, this year-over-year data is packed with valuable insights.
Let’s dive into the highlights.
► Side-by-Side Comparison: 2024 vs 2025
Here’s how the key metrics stack up:
|
Category |
2024 |
2025 |
|
Global Users |
366 million globally |
390+ million users |
|
Daily Usage Time |
68 minutes/day |
73 minutes/day |
|
Dominant User Base |
Gen Z: 42% of users |
Gen Z: 49% of users |
|
Right Swipe Rate |
14% |
13.2% |
|
Match Conversion Rate |
6.7% average |
7.4% average |
|
First Message Sent |
34% of matches result in messages |
37% of matches result in messages |
|
Popular Regions |
North America, Europe |
Southeast Asia, Latin America |
|
Feature Trends |
Voice prompts, detailed bios |
AI openers, video chats |
|
Top Apps |
Tinder, Bumble, Hinge |
Hinge, Bumble, Rizz AI, niche/AI-first platforms |
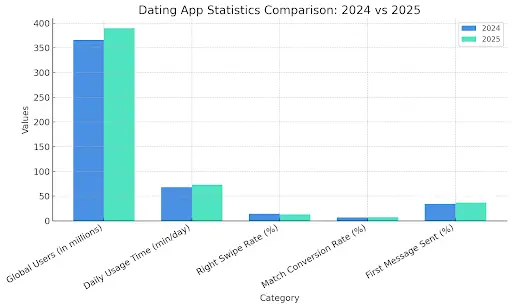
Chart: Dating App Growth & Behavior (2024 vs 2025)
To give you a quick visual breakdown, here’s a bar chart comparing five major stats -- from global usage to swipe and message rates:
-
- Global usage is climbing steadily.
- Users are spending more time on dating apps.
- Swipes may be slightly down, but matches and message rates are up.
- Behavioral shifts suggest people are becoming more intentional with their app use.
Where the Dating App Industry is Headed Next?
As the digital world evolves, so does how we connect romantically. The future of dating apps is deeply tied to emerging technologies, especially AI in dating apps, which is transforming how people meet, match, and engage.
Here are some notable shifts backed by recent online dating market app statistics:
-
- AI-Driven Personalization: Over 70% of Gen Z users say they prefer dating apps that offer personalized matches using artificial intelligence.
- Voice & Video First: Apps with video chat features saw a 35% higher user engagement rate in 2024.
- Behavioral Analytics: Platforms leveraging behavioral data had a 40% increase in match success, according to statistics of online dating apps.
- Safety & Verification: Dating apps that implement AI-based identity checks report a 60% decrease in catfishing incidents.
- Rising Market Value: The global online dating market is expected to surpass $12 billion by 2030, based on the latest dating app statistics.
These dating app trends indicate a future focused on smarter, safer, and more emotionally aware dating experiences.
► What This Means for You?
If you’re building or investing in dating apps, the 2025 stats show a shift toward quality over quantity.
Users are being more selective but more engaged. They want smarter features -- AI, authenticity, video -- and apps that do more than just match profiles.
This isn’t just a social trend -- it’s a massive opportunity.
Want help building an app that matches these trends? Or integrating new features into your existing platform? Let’s talk -- we build dating apps that actually convert.
Turn Your Dating App Idea into Reality with JPLoft’s Expertise
With over 366 million people using dating apps globally, the market is booming– and it's only expected to grow.
Platforms like Tinder, Bumble, and Hinge generate billions in revenue annually, proving that modern matchmaking is a lucrative space for tech entrepreneurs.
At JPLoft, the best dating app development company, we specialize in turning innovative dating app ideas into high-performing, user-friendly platforms.
From envisioning a niche dating experience to a feature-rich mainstream app, our team brings the technical expertise, design finesse, and scalability you need to compete and thrive.
Let’s build the next big thing in digital dating– together.

Wrapping Up
In conclusion, these dating app statistics offer deep insights into user behavior, engagement patterns, and market growth. They highlight how preferences vary across age groups, genders, and regions, revealing key trends shaping the industry.
Separately, the broader dating market statistics showcase the immense revenue potential and increasing demand for niche and innovative platforms. From developing a new app to investing in the space, these figures emphasize the importance of data-driven decisions.
By leveraging these sets of insights, businesses can craft more targeted experiences and tap into emerging opportunities within the ever-evolving world of digital dating.
FAQs
Yes, statistically, dating apps lead to 1 in 3 marriages and long-term relationships today.
Yes, nearly 79% of Gen Z users report experiencing dating app burnout due to swiping fatigue and emotional exhaustion.
Roughly 17% of dating app users find long-term partners or marriages via the platform.
Tinder leads with over 75 million monthly users globally, making it the most-used dating app.
About 12% of dating app matches evolve into long-term, committed relationships.

Rahul Sukhwal is the CEO and Founder of JPLoft, a visionary technologist with 18+ years at the forefront of emerging tech innovation and software engineering. He channels deep software engineering and AI expertise into building smarter, scalable solutions that shape how forward-thinking businesses worldwide harness the true power of AI.


Share this blog